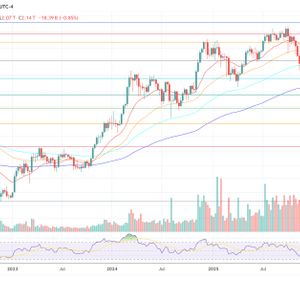
Zilliqa price analysis looks very bleak since the (ZIL)/ USD pair has now developed a bearish bias. This bias is evident across the short-term charts with the price still below the 200-period moving average (MA) on the four-hour time frame. The chart also shows that the price of the pair is trying to achieve a breakout below current price levels. All technical indicators have turned bearish and indicating momentum towards the sellers. Zilliqa price chart by Trading View If a breakout occurs, it is expected to be a double-digit move at the least. The relative strength index (RSI) is still